Author: Suadi

  • Lesson from the Environmental History of the World

    A few interesting points of Ideas and Impact of J. Donald Hughes (An Environmental History of the World: Humankind’s Changing Role in The Community of Life).

    1. Human system of ideas about the natural world might be classified into three general categories:

    a. Traditional à evolving system that included earlier ideas with new ones that might be found in the Hinduism, India and Shinto’s thought in Japan. The symbols and practices of ancestral on hunting-gathering, agrarian, and pastoral societies and the attitude toward nature typical of them. They have already transmuted but the process of change in these systems was typical evolutionary than revolutionary. They tend to retain the worship of natural entities including nature gods and their teaching practice might embody the issue of conservation of nature.

    b. System created by reformers à the reformers who taught the oneness of life including the humans and nature. Those people are Mahavira (Jainism), Sidharta Gautama (Buddhism), Lao Tsu (Taoism), and philosophers. They view the universe as an organism of which humans and other creatures are parts. The behavior of creatures is closed related to the motion of the nature. In Buddhist ethics we can find the teaching of “do not harm” neither to humans, to animals or plants, or to things usually considered inanimate, so does in Jainism (well known as ahimsa). Taoism also counseled their followers making few demands on environment. Appreciate the nature is a few key words of those reformer teaching.

    c. Monotheistic religion à this faith made humans God’s steward with dominion over and responsibility for the creation. This group arose under the monotheistic faith including in Zoroastrianism and “Abrahamic” religions (Judaism, Christianity, and Islam) in which they believe only to one supreme God. Humans are his representatives, and their donation over and stewardship of the earth and its non-human inhabitant must be exercised within ultimate responsibility to the creators. In Islamic thought, for example, human depicted as a steward on the earth, they have power to regulate the nature, and they must be in obedience of God’s law including to protect it and to not make destroy it. Nevertheles, those religions, have been blamed for motivating ecological damage because they seem to separate God from nature, leaving nature without spiritual worth, and because by placing humans above the rest of creation, they apparently give them permission to use other creatures and the earth itself without considering they have any value of their own. It is, however, to other historical factors that we must look for the explanation of the fact that the homelands of that monotheistic faith became environmentally devastated even in early times.

    2. Two important roles of human in the changing process of natural world in the late of ancient history might be classified into types:

    a. The human attitudes to nature including their ability to organized number of people in vas project that transformed the landscape.

    b. The human action impact to natureà including pollution, deforestation etc.

    3. How do those human roles in historical perspectives of their relationship to nature, there are three examples lesson from Athens, Xian, and Rome in the ancient times.

    a. Athens: mind and practice

    The philosophers dominated the system ideas of the ancient Greek. The philosophers had great ideas about development particularly in building cities and their associated work. The people, however, who actually built and operated them did not always trust and followed the philosophers.

    Water is a limiting factor in Athens thus in 530 BC a famous tunnel on the island of Samos was constructed to carry an aqueduct to the city. It was taking from springs in the hills (length 1000 m). Euphalinus designed it perfectly based on the order of the tyrant Polycrates, but the contractor of that building did not rely on the theoreticians and resorted it to trial and error. Plato and Aristotle were other philosophers known introducing issues on conservation of water including on the new construction of tunnels, irrigation and fountains project. Related to extraction of water from the arid countryside, its impact to the biota also existed. Thus, water purification had come to issue in this city.

    Even in the Greek city-state, the city and countryside consider as a unit, but city seemed became the main concerned. This city grew organically and planlessly, thus the environmental deterioration in ancient Athens foreshadows the modern ones. Athens suffered from crowding, noise, air and water pollution, accumulation of waste, plagues, and additional dangers to life and limb.

    Philosophers suggested the ruler to consider the population number regulation (limiting the numbers). They also introduce a concept of “autarchic” city, the city that could raise its own natural resources needed from its own territory. Even though, this idea was not achieved in the classical Athens due to its local ecosystem limitation, thus the Athenians enhancing trade and conquest through a development of military powerful city. Forest product was one of important trading commodity as well as the main source of shipping industry and the shipping fuels. Related to the forest issue, Plato and Aristotle emphasis the important of conservation and both introduce some practical suggestion to avoid further deterioration of this resource. By the mid-fifth century BC, the surface of Attica, Athens’s land, was largely deforested. Deforestation affected to the declining of the agriculture and a chronic shortage of wood and other forest product. Such condition drove the Athenians to expand the timber searching from abroad and group of Athenians colonist’s were dispatched to some others region abroad.

    Many problems found in the modern city are not new, ancient cities knew them to greater or lesser extent. The economic factor was one of the most importance factor effected the environmental problems and in the ancient drove a philosopher such Aristotle to gave his more attention to the role of environment and resources economic. In his opinion, economy and ecology share the same Greek root, and their concern cannot be separated without danger. Even though, the philosopher’s ideas in ancient Athens were not actual practice and they are only a tiny minority. The failure of Athens to adapt its economy to natural system in harmonious ways is a cause of its decline, and is one reason why the power it exercised in the Golden Age did not persist very long into Hellenistic period that followed.

    b. Xian: Chinese environmental problems

    Xian, an ancient capital, is redolent of the Chinese past. Qin Shi Huangdi inspired awe among people and he well-known for his great idea to build the Great Wall. To grow an efficient bureaucratic autocracy Qin emperor commanded the scholars to desist from discussion the past and buried alive who protest. He also commanded to burn all books related to various discussion of philosophy, except those dealing with important issues such medicine, pharmacy, agriculture, and arboriculture, as well as divination by tortoise shell and yarrow.

    There are hundreds of schools of philosophy in the decades before Qin conquest China. Those schools thought a good relation between human and the nature and people to live in a “good and simple life” (doing as little interfere with the natural order as possible) as depicted in the basic text of Taoism written by Tao Te Ching (lived in 6 century BC). In fact, the animosity of Qin Shi Huangdi to the Confucians was not based on their attitude to nature, but to their critique on ruler who failed to follow what those schools consider as the right custom.

    Mencius (lived in 4 century BC) depicted the rapid economy and environmental change of China particularly when business involved in markets and trade were actively done. What Mencius depicted for the China case was similar to Plato concerning the Athens. To avoid further environmental degradation, Mencius suggested a land management as one of the most important responsibilities of the state. He advise ruler to make periodic inspection tours of their domains, and to observe the condition of the land. Concerning to the deforestation and removal of wildlife issues, in Mencius’ time, the expansion of agriculture into undeveloped land was the major force. Furthermore, the ruler also established gardens, parks, and preserves that were not a wilderness.

    Philosopher such as Mencius has criticized the extravaganza life of many nobles which wasteful resources. Even Mencius advices a middle way, some modern Chinese commentator have criticized Mencius as the “anti-development”. In most case, the ruler of China was also not taking seriously into account to the Mencius advices. The legalist philosophy was more favored to the Qin Emperor when it allowed private ownership to self-interested farmers and restricted the businesspersons. To Qin emperor, the problem of short food supply could be avoid by using two methods: i) bringing more land under cultivation and by constructing irrigation systems; and ii) store grain in years in wide areas under his military power that covered whole China.

    Even the fall of the Qin dynasty was not mainly caused by the decline of the environmental of China (particularly deforestation), and it was by his ostentation particularly when he constructed a huge palace for him self in Xian (in 212 BC), this issue became a strongest one for his opposition to fight the emperor. Finally, this dynasty only has a short-lived, and so did his successor. In the Han dynasty that followed, the teaching of Confucius and Mencius returned to favor. The new leader introduced some new policies and kept some Qin policies continued especially those dealing to agriculture. However, the time to come would see an uneven but inexorable rise in population; it was also a lamentable lost of forest occurred, and danger from famine still continued in spite of expansion of agricultural land.

    c. Rome: environmental reasons for the decline and fall

    Number of interacted process brought down the Rome decline. One of these was the Roman mistreatment over their natural environment including the over exploitation of scarce natural resource such as forest and soil. Roman also failure to find sustainable ways to interact with the ecosystems of Italy and the many others land including Dacia, which they conquered. Deforestation and its consequences, erosion, lead the list of disasters. Agricultural crises were responsible for rising prices, food shortages, and labor shortages. Even Industry did not make up as large segment of the economy as today, but it had significant environmental consequences such as pollution, deforestation, ice caps, etc.

    Roman attitude to the natural world failed to maintain a sustainable balance the Mediterranean ecosystem within which they lived. The root was the short-term profit and shortsighted. The trend of the Romans’ action affecting the environment over the centuries was destructive. They exploited renewable resources faster than their ability to recover, and consumed the renewable resources as rapidly as they could. Thus, environmental change as a result of human activities supposed could be judged as one of the causes of the decline and fall of the Roman Empire.

    4. Conclusion

    a. Systems of ideas have power to shape human action. When they commanded the allegiance of human societies, system ideas have built institution and monuments, stimulated conquest as well as resistance to conquest, and changed the face of the earth.

    b. The use of the system ideas by states is far more common than the attempt of states to follow those systems whenever they conflict with what the state consider being their own interest. Therefore, the fact that environmentally positive teaching can be found in ancient religion and philosophies do not always surely indicate that they were put into practice.

    c. The religions and philosophies that wish to help our species adapt, survive, and at same time preserve, the community of life must be able to change, discarding outmoded formulation and recognizing the need to respond to ever-new environmental challenges.

    Let`s share knowledges, sciences, and experiences
    Technology, Partnership & Equality
  • Indonesia after Economic Crisis: A Poverty Issues

    This is some interesting points from a book entitle “Indonesian Living Standards Three Years After the Crisis: Evidence from the Indonesian Family Live Survey” written by Center for Population & Policy Studies Gadjah Mada University Yogyakarta, RAND, and Partnership for Economic Growth USAID.
    1. Real per capita GDP rose four-fold between 1965-1995. with annual growth rate averaging 4.5% per year.
    2. The poverty head count rate declined from over 40% in 1976 to just under 18% by 1996.
    3. When economic crisis hit in the medio 1997, the GDP growth decreased to between 12-19% until 1999.
    4. The economic crisis affected the poverty increasing to 27% between 1997 and late 1998. The increasing of rice price became an important factor because it share 20% of the poor budged share. While, the income of the non-poor was predicted decreasing to 20%.
    5. The data in this study was obtained through IFLS (Indonesian Family Life Survey) conducting in 1997 and 2000. The total samples were 33,441 people in 1997 (15,770 people in urban areas) and 42,733 people in 2000 (20,732 people in urban area).
    6. The FPI (food price index) since the economic crisis has increased 3 times, thus when the share of food is higher to the total expenditure for a certain areas there would be the economic crisis impact badly to the people in the area.
    7. The share of food in the rural area is higher compare to the urban areas and it was predicted 56.3% in 1997 and 56.8% in 2000. The food expenditure for the poor is the highest (58,1% in 1997 and 57.6% in 2000). Thus we may say, the poor and the rural community particularly the non-food producer might have been theaten badly by the economic crisis. I should note that the rice was one of the most important food expenditure variable that used in this study inwhich at national level its share reached 13.8% in 1997 and 11.4% in 2000.
    8. The other interesting finding of this study was the poverty number since and after the economic crisis. At national level, the poverty numbers reached 17.4% in 1997 became 15.5% in 2002. The poverty number in the urban area was 13.3% in 1997 became 11.6% in 2000, while in the rural area the number was higher to reached 20.1% in 1997 and 18.7% in 2000. The reseach also depicted ditail figures of individuals living in poverty propotion based on their ages in which the children was badly impacted by the crisis.
    9. Based on those data, I would like to mentioned two points: first, there was a decreasing trend of the poverty at the national level or based on the area chategory and ages three years after crisis. The second, the movement FPI, as mentioned previously in point number 7, contribute positively to the movement of the poverty numbers. Thus, food will still become one of crucial issues in the current Indonesian development discourse.
    10. Well, how about the current policy on new fuel price released 1 October last year? Recently, government also plan to make new policy on electric tarrif (TDL), how about this one? Is it also such energy crisis (particularly the oil) will give the same impact to the poverty as the economic crisis? The impact of such policy to the inflation might become the main key factor particularly to the particularly to the food price in which has determined as the key indicator to assess the poverty number. Let me to cite one simulation data published by Teguh Dartanto (click Inovasi Online) in which the policy on new fuel price on October 2005 increase the poverty number 1% or 2 million people (the intial number 16.25% based on BPS data). Thus, the oil crisis will also become the other important issues of the current Indonesian economic development.
    11. How about the poverty of the community in the pesisir? Well, the poverty in the pesisir is not only corelated to those mentioned-issues but also link to the scarcity of the natural resources, let we say fishery resources. But, let me discusse about this matter next time with the spesific issues.
    Let`s share knowledges, sciences, and experiences
    Technology, Partnership & Equality
  • Quantitative Aspect of Agricultural Development in Japan

    Quantitative Aspect of Agricultural Development in Japan

    Summary of Chapter I of the Agricultural Development of Japan: a Century’s Perspectives, by Hayami, Y. and S. Yamada, 1991, University of Tokyo Press.
    Agriculture in this discussion only covers the farm sector and does not include forestry and fishery. The analysis based on the historical statistic data, recorded since early of Meiji Era (1868) up to 1985, to determine the changes or the trend in agriculture growth in term of agriculture product, input, and productivity in the modern Japan.
    The Japanese agriculture chronologies might be ascertained as follows: 1) Period I, approximately 1880-1990, we may called steady growth; 2) period II, 1900-20, accelerated growth; 3) period III, 1920-35, relative stagnation; 4) period IV, 1935-45, devastation by World War II; 5) period V, 1945-1955, postwar recovery; 6) period VI, 1955-70, rapid growth; and 7) period VII, since 1970, stagnation. For a broader phase, the period I and II we may call “initial growth phase”; period III as “interwar stagnation phase”; period V and VI as “postwar growth phase”; and the last period as “recent stagnation phase”. Those chronology and phase will be explored in this brief summary of this chapter.
    Agriculture in Economic Development
    The shift pattern of economic development from rural based to industrial based primarily occurred in the Meiji era. In the early of Meiji era, agriculture share predicted around 69% of total workers around 21.86 million people, to only 8.7% in 1985. While agriculture shares to total NDP decreased to only 3.9% in 1985, from 38.4% in the early of Meiji era. The rapid decreasing rate was occurred in the period after World War II (in average more than 20% per year), particularly in the period between 1950’s-1960`s in which industrialization and economic growth develop rapidly. As a result, Japan economic has shifted from predominantly rural country to the one of the most highly industrialized nation in the world.
    Trend in Agriculture Output

    The trend analysis includes the growth in aggregate output and production by commodity groups. Figure 1-1 (page 18) and Table 1-2 (page 19) indicated the trend in total production, total output, gross and net value added. Based on the data, the growth trend as previously mentioned might be divided into seven periods, but to simplify the agriculture output growth were categorized in four major phase. They are: (a) relative rapid growth until the 1910`s, (b) relative stagnation in the interwar period, (c) a spurt following World War II up to the 1960s, and (d) stagnation in the 1970s and 1980s. The first phase was indicated by relative fast growth of total production and output that reached 20% and 25%, respectively. Even the growth of gross and net value added though less clear in this period, this rapid growth parallel to industrial growth. Fortunately, in the second phase the agriculture entered the stagnation phase, even the industrial sector continue to expand, in that the agriculture output declined to more than 50% compared to previous phase. The shortages in labor and other input for agriculture due to the military expansion to China and followed by the pacific war might become some reasons a sharp declined of the agriculture performance. The rapid growth of agriculture, called a spurt, was occurred again after devastating by World War II up to 1960s in which the total production and output far above the prewar period. As the structural adjustment to industrial country, particularly in the year 1970s-1980s, the agriculture output shift again to a distinct stagnant in that total production, output, and value added decreased to more than 70% compared to other period after World War II. Moreover, in the postwar period, the increases used of non-farm input (fertilizers, machinery, etc.) and fixed capital drove the total agriculture product and output growth more rapid compare to its gross and net value added.
    Similar to the overall agriculture output, by the commodity, we might be also sequenced the commodity output growth into four phases as previously discussed. However, as a great important commodity, rice, even yearly grew slowly, the major determinant of the growth pattern of total production. In contrary, livestock even become a critical component to determine the total production in the postwar period (grew 9% per year); it was started from negligible level in the prewar period. In addition, the sericulture growth rapidly from the early period of Meiji Era until 1920s, but continued to decrease after this period. The world depression and the competition from artificial fibers might contribute to the decreasing trend of sericulture. Thus, sericulture finally reduced to such low level and might affect the aggregate growth rate.
    Labor and Land in Agriculture
    Labor and land is very important factor in agriculture development in Japan. The number of labor decreased slightly, at the average rate of 0.1% per year, for the entire prewar period. Even the number increased immediately after World War II, it began to decline sharply with the outset of the rapid economic growth in the mid 1950s. According to their workhours, for period 1880-1920 the number of workhours rose by 36%, while the number of farm workers decreased by 5%. Due to the double cropping paddy field practices and expansion into sericulture as sideline enterprise to the production of staple cereals resulted the increasing in workhours per worker of 42%. Nevertheless, after 1920 the workhours tend to move parallel to number of workers, then followed by sharply declined in the postwar period, particularly in the rapid economic growth period from 1960s to 1970s.
    Similar to labor state, the cultivated land or cropland also increased steadily at the average 0.5% until 1920, then stagnant that after. Moreover, the rate of land utilization has been sensitive to changes in the demand and supply of farm labor. As the land become the limiting factor, the productivity of land and labor are two important factors generated the growth of agriculture in Japan. The major element in explaining the increase in output per farm worker was the rise in yield per hectare for the prewar period and the postwar period until 1955 in which 70% of the growth in output per worker is accounted for by the increase in output per hectare. However, the contribution of improvement in cultivated land area per worker to the labor-productivity growth rate has become the major element since 1955, when the absorption of the agricultural labor force by industrial and service sector accelerated. In other words, in the postwar period the improvement in the land/labor ratio played a significant role in the growth of labor productivity when the labor input sharply declined.
    Factor Input, Factor Price, and Factor Shares

    Agricultural production factors in this discussion classified into four categories i.e. land, labor, fixed capital, and nonfarm current input. Over the whole period, the inputs of the two primary factors, labor and land, and capital changed slowly relative to nonfarm current inputs in the prewar periods. However, in the postwar period capital increased, while labor decreased, both at rapid pace, reflecting the rapid progress in farm mechanization. The rates of growth in current inputs, particularly fertilizer in the prewar period, and feeds in the postwar period, far exceeded those other inputs. Related to the factor price, the rapid rise in the price of the farmland for the prewar period indicated the fact that land was the limiting factor for agricultural production in this period. While the rapid rise in the farm wage rate in the postwar period implies that labor has becoming the increasingly scarce relative to other factors in recent years. The rapid decline in the price of fertilizers relative to the price of land can be identified as a major force that induced the substitution of fertilizer for land, thereby increasing the input pf plant nutrients per unit of farmland area. Likewise, it is clear that the relative decline in the price of machinery capital vis-a-vis the farm wage rate has been a stimulus in the substitution of machinery for the labor. In other words we can said that the technical progress in Japanese agriculture was of the land-saving and fertilizer-using for the prewar period and that it began to bias toward the labor-saving and machine-using direction when labor shortage became serious after around 1960.
    Total Input and Total Productivity

    The total input in this term is the aggregate of single index of labor, fixed capital, and nonfarm current inputs by factor-share weights, and expressed as chain-linked index. While the total productivity defined as the index of total output divided by the total input and expresses the technical efficiency or the changes of output per unit of input in agricultural production. Over the whole period, the indices of total input in both flow and stock term increased at the annual rate 0.4% while total output grew at 1.6%. Consequently, total productivity rose by 1.2% per year in both terms. This implies that roughly, 1/4 of the growth of total output is explained by the growth in input, or 3/4 output growth is left unexplained by increase in conventionally measured inputs. Even though, there were large variations among periods in the rate of growth in total productivity as well as its relative contribution to the output growth rate (Figure 1-13). The increase in the rate of output growth from period I to period II was associated with the rise in the input growth rate, but through period I and II, productivity growth was the dominant factor in determining the growth rate of the total output. The interwar stagnation in the period II and III might well explain the deceleration in the rate of growth in productivity in this period. In period IV, the performance declined significantly due to the devastation of World War II, even followed by the high rates of output growth in the period V and VI. However, the output growth in period V for recovery from the war was largely explained by the increase in inputs, the output growth in period VI is largely explained by a rise in productivity. From period VI to VII the growth decelerated significantly. Labor and land inputs continued to decrease through out period VI and VII. Even the capital and nonfarm current inputs increased rapidly in period VI, slowed down markedly in the period VII. The growth rates of total productivity declined by 30 to 50% from period VI to period VII. Thus, the stagnation of output in agriculture was the combined effect of decrease in input use and deceleration in technical progress.
    Recapitulation of Major Growth Trends

    Even the agriculture performance rose and down since the beginning of industrialization in early of Meiji era until recently, in average the agriculture growth positively in average 1.5% per year. Field crops, particularly rice, continue to dominate the Japanese agriculture, even we also found the rise and fall in sericulture and the rapid increases of livestock after World War II. In contrast to output growth, the two primary inputs in agriculture, labor and land, remained stable. Since the land/labor ratio improved only slightly, the growth in labor productivity was primarily brought about the rise in the use of fertilizers and other current inputs, which are primarily substitutes for land. The improvement of land/labor ratio has become the major component in the growth in labor productivity since the beginning of the rapid economic growth in the mid-1950s. Moreover, the growth in land productivity was associated with the rapid increase in the use of fertilizers and other current inputs, which are primarily substitutes for land. While the improvement in the land/labor ratio was associated with an increase in capital stock, particularly in the form of machinery and implement per worker, which are primarily substitutes for labor.
    An International Comparison

    As a comparison, some countries in Asia, USA (continent region), and Netherlands (Europe) were selected to describe the relative levels of output, input, productivity, the land-labor ratio, and their historical trend. According to their land-labor (Table 1-15), Japanese land-labor is only 1.2 ha per person, similar to other Asian countries, but it is 100 times in larger in the USA and only 7 times larger in the Netherlands. Moreover, the labor productivity of Japanese agriculture is also lower, only 1/12 of the USA and 1/10 of the Netherlands in terms of both total production and gross value added. Even though, the labor force declined in all three countries for over a century since 1880. The average growth rate of total output in both Japan and the USA was 1.6% per annum, while the Netherlands achieved much higher rate of 2.6%. While labor increase 0.3% per annum in USA and Netherlands, in Japan decrease 0.1% due to the unfavorable land endowment in that rural population migrate to town even in the early stage of industrial development. After World War II, the output growth rate decreased sharply in Japan from 3.2 to 0.5% per year, while it remained about the same in other two countries (Table 1-17). The rate of growth in land productivity also decreased significantly from 3.1 to 1.2% in Japan, while it increase from 1.8 to 2.5% in the USA, and remained at about 4% in the Netherlands. Similar characteristic also figured out on the total productivity in which decreased 2.4 to 1.2% per year in Japan, while it remained about 2% in the US. Compared to the other Asian countries, in which most of them experienced with the Green Revolution, the output growth rates in Japan is similar to some countries such as Indonesia, India, and Pakistan, even lower compare to Taiwan, Korea and Philippines. Even though, in perspective of labor, the newly industrializing countries such Taiwan and Korea have the same figure with Japan in which the labor absolutely decline, even in differences rate. Nevertheless, in other Asian countries the labor still increasing, resulting the decreasing on land-labor ratio. While total productivity improved in all countries but the rates different from country to country.
    To summary the international comparison, the Japanese agriculture has shown a good performance in the prewar period, in most of indicators better than USA, even the Netherlands. How ever, since the post war particularly after 1970 Japanese agriculture has lagged behind the two countries in out put and productivity growth rates, even lower than in many other Asian countries. Thus, protection has characterized the Japanese agriculture recently.
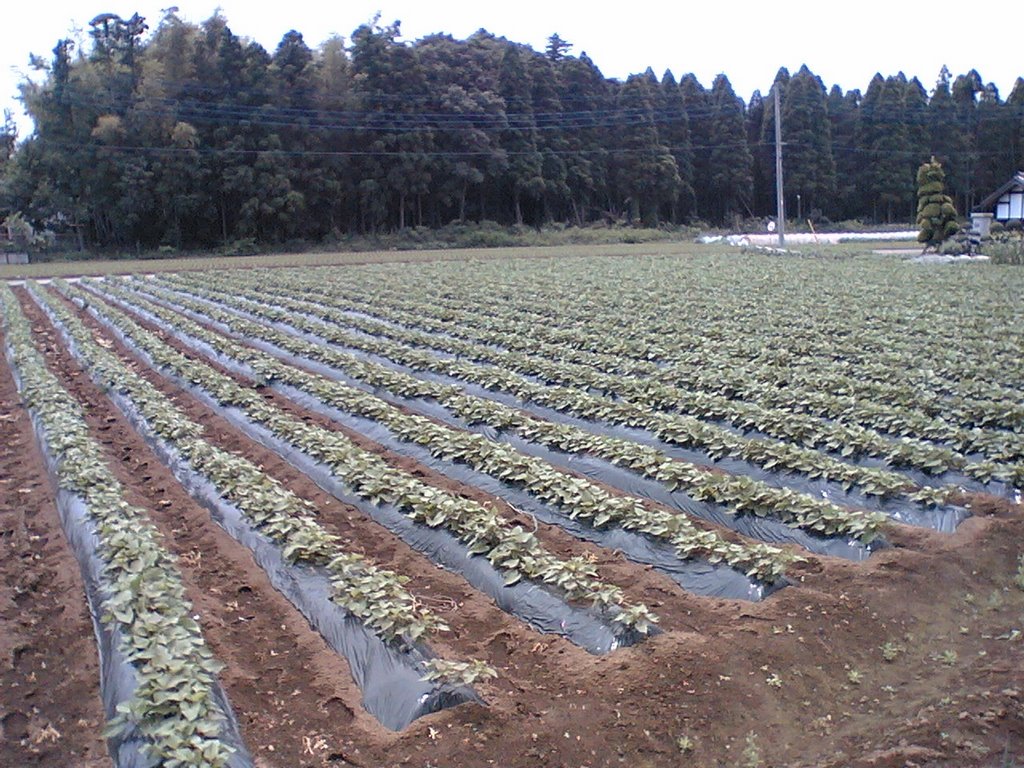
    (Picture: Horticulture in Ami-machi, Ibaraki, Japan)
    Let`s share knowledges, sciences, and experiences
    Technology, Partnership & Equality
  • Institutional Aspects of Agriculture Development in Japan

    Institutional Aspects of Agriculture Development in Japan

    A Summary of Chapter II of the Agricultural Development of Japan: a Century’s Perspectives, by Hayami, Y. and S. Yamada, 1991, University of Tokyo Press.
    Transition to Modern Agricultural Growth

    The society was under rigid hierarchical class structure during Tokugawa regime, in that social mobility was low, and occupations were determined by blood. Based on this class, the feudal lords and samurai determined the tax revenue including from peasant in type of rice tax. To ensure the sustainability of this tax, the peasant activities were also restricted with some rules including their relation to their land. The dominant character of farming in the Tokugawa period was large holding. When the intensive cropping system developed the small-scale based on family labor to be more consider.
    As the market economy developed, the peasants got the opportunity to raise the agriculture productivity for selling to the market. Improvement in agriculture technology such as the use of fertilizer, improvement of flood control and irrigation positively contributed to the agriculture development. To prepare for open/market economy system, under the modern nation of Emperor Meiji, the feudal constraints were removed on economic activities one by one. Thus, some new policies introduced include 1) free to growth crops or mortgage the land for the farmers (1871/1872), 2) the land tax revision (1895), and 3) promotion of better education system. From those mentioned policies, land tax revision was the most important reform in the Meiji era. This policy aimed to secure the stable source of government revenue for modernization. Thus, most agricultural resources transferred to nonagricultural sector for this purpose. The communal resources such pasture and forests were also transformed to the wealthy landlords or to the government ownership to establish the land title for the tax sources.
    Unfortunately, for small-scale farmer, the dominate farmers (Table 2-1, page 66), in some cases this policy did not contribute positive economy impact due to the common resources as the main sources of fertilizer, fuel, and feed had been transferred to the landlords or government. Related to the technology development, western and US agriculture model was chosen. Thus the use of modern input such fertilizers and machinery combined with organic farming was the main form.
    The government also established agriculture education and training center such as Komaba Agriculture School (later become college of Agriculture Tokyo University in 1890) and Sapporo Agricultural School (later become college of Agriculture Hokkaido University in 1918). Unfortunately, in this importation technology only the industries gained the successful, while agriculture was great unsuccessful due to the technology incompatible.
    Initial Growth

    Learning from the previous unsuccessful story, government began to develop technology consistent with their local ecological condition. The Iterant Instructor System and the Experiment Farm for Staple Cereals and Vegetables (1885) began to diffuse seed varieties and more productive cultural practiced already in use by Japanese farmer. The agriculture education was also reoriented from British based to German style. Thus, education and research in which agriculture chemistry and soil science of von Liebig tradition were established. Even though, insufficiency of facilities and logistical supports always handicapped the development of experiment farm and research. The output and productivity of agricultural were accelerated at the beginning of the 19 century.
    The indigenous technology development in seed selections such as in rice whose done by the rono, veteran farmers, then followed by the promotion of agriculture society were importance factors to this acceleration. While the agriculture society took responsibility for technology dissemination, the cooperation played important role on making better bargaining position of farmers and guarantee the agriculture product marketing and capital credit. The location-specific technology growth also motivated to the raised of land productivity. However, the application of fertilizer seems required to substitute the limitation of the land. Thus, the commercial scale of fertilizers began to growth such as the Tokyo Artificial Fertilizers in 1888. A relative well-develop land infrastructure from the Tokugawa period also made possible the application of seed-fertilizer technology. The Meiji government also promoted land-improvement project and special bank support to this project. The participation of landowner also became a compulsory in this era. As the expanding demand of silk, a number of technical and institution were also established. The summer-fall culture also develop, thus increase in efficiency of labor utilization by providing employment for seasonally idle labor.
    Interwar Stagnation

    The rapid agricultural growth in the later half of Meiji era might be consider driven by 1) the successful on the development of indigenous technology, 2) the feudal constrain reform, 3) good relationship among farmers (including innovative landlords), agricultural scientists, and agricultural supply firms together with 4) the proper guidance of the government. However, as the industry growth rapidly, the investment on nonfarm increased rapidly. The innovative landlords also shifted to this business and tend to become “parasitic landlords” (page 77), particularly in the late Meiji era and Taisho era (1912-1926). Thus, the political champagne of those landlords also move from agricultural productivity to agricultural protectionism. As a result, the indigenous technological potential exhausted exists and followed by deceleration of agricultural output and productivity (in 1910s). Unfortunately, this decline coincided with the boom of World War I, forcing farm price to rise to an unprecedented high level that caused social unrest and culminated in the Rice Riot (Kome Sodo) triggered by fishermen wives in 1918. Importing rice policy from Korea and Taiwan was chosen to overcome the riots. This program was followed by the “Sanmai Zoshoku Seisaku” policy in that high-yielding Japanese rice introduced to those colonies. This policy succeeded in increasing in the flow of colonial rice to Japan.
    However, as the world recession (1920s) hit Japan and the aggravation deflationary policy, the serious agricultural crisis was existed. Thus, government began to adjust the rice supply in the market by 1) engaging in the rice purchase, sale, storage, and processing, and 2) restriction import from foreign countries (Rice Law of 1921), and 3) Rice Control Law that replaced the amendment Rice Law authorized the government to buy and sell unlimited quantities of rice at the floor and ceiling price. In the farm level, 4) government spend on rural infrastructure, 5) liquidation of farm debts from usury by releasing credits from the postal saving funds, and 6) promote self-sufficiency as well as the 7) agriculture cooperation. Since 1926, 8) government also promoted the tenancy system of the landlords land into owner cultivated area thus agrarian structure of Japan shifted. Even the whole agricultural performance in this period was stagnant, new potential agriculture technology was accumulated. The research institute were also reorganized, even the breeding (rice) still became the main focus.
    Agricultural Development since World War II

    After devastated by the World War II, Japan tried to secure food supplies from domestic agriculture through some program such as 1) several incentives schemes; 2) emergency land-settlement program; and 3) Differential Production Scheme in which fertilizer industry together with coal mining and iron steel industries was given high priorities; and 4) continuing land reform (1946-50) and the reorganization of the agricultural cooperative association.
    To execute land transfers, an Agricultural Land Commission was established in each village, consisting of three representatives from the landlords, farmers, and tenants. The successful of this reform was related to the power of occupation force and the backlog of knowledge and experience of land-tenure system. This reform promoted more equal assets and income distribution among farmers, thereby contributing critically to the social stability of the rural sector. Reorganization of agricultural institution also contributed positive impact on agriculture growth. Nogyokai that was designed to share responsibility of controlling and mobilizing village economies for war purpose, transfer to agricultural cooperative association in 1947. Structurally, this cooperation covers the village, prefecture and national level, in which took a function as marketing, bank, insurance and political lobbying institution. Thus, agricultural production recovered rapidly from its 1945-47 botom. By 1952 direct government control on food commodities, except for rice, had been lifted, and the food shortages completely disappeared with the bumper crop of rice in 1955.
    Technological potential accumulation since the 1930s under the Experiment System, the rehabilitation and improvement of flood controls and irrigation facilities, are some major factors underlying rapid growth in the post-World War II. This growth was further enhanced by the supply of new industrial inputs such as insecticides and pesticides, and the farm mechanization. Those factors were such type of response on the relative rise in farm wages, due to labor out migration from agriculture, particularly in the late 1960s.
    Agricultural Adjustment Problems

    Agriculture began to face the adjustment problem as the miraculous economic growth since 1950s. Since the agriculture worker output lag behind the industry sector, the level of income and living for this households lagged behind urban households. Thus, the major goal of agricultural policy shifted from an increase the production of food staples to reduction in the rural-urban income gap. The New Village Construction Program that was initiated in 1965 encouraged to promote the cooperative agricultural development plan in order to increase the production of commodities having high economy value such as livestock, fruits, and vegetables. This program was also supported by some credits scheme to rise the purchase of livestock, pasture improvement, etc.
    The major constraint on the increase in agricultural productivity was the small size of the farm units. Thus, protection on farm-product price and restriction import was such type of farmer request to the government. In 1960, strong political pressure from farm organization finally resulted in a rice-price determination formula. The “Production Cost and Income Compensation Formula” that so-called formula were determined by the cost of production of the paddy filed, in which the wages for family labor are valued by nonfarm wage rates in order to guarantee fair returns for the labor of rice produces. This policy drove the increases in rice price and contributed to the reduction in the gap between farm and nonfarm income and wages (Table 22, page 92). Thus, after the enactment of the Agricultural Basic Law in 1961, the price at which the government purchased rice from producer increased very rapidly and was consistently higher than the government sale. The domestic production also expand, while consumption remained stable until 1965 and decreased rapidly there after, resulting in accumulation of surplus rice in government storage. Rice control program consumed a large percentage of central government budgets (Table 2-3, page 94). Disposal surplus-rice program succeed in eliminating the excess rice supply.
    The international pressure (GATT Uruguay Round) to reduce the agricultural protection was another important factor that preventing rice price supports rising significantly in the 1980s. As the food self-sufficiency decline, import increase sharply in the last two decades particularly in nonrice cereals and soybean (Table 2-4, page 95). Although trade liberalization has progressed rapidly in Japan, it has not been satisfied the demand of agricultural exporting countries in the face of extremely rapid expansion in manufacturing exports from Japan.
    Recently, the international friction concerning the agricultural commodities imports has become one of the most critical policy issues not only for the agriculture but also for the whole economy. The domestic agriculture efficiency is the long term answer to compete international. As mentioned previously, the challenges were 1) the limiting of land size that become barrier to the agricultural growth particularly in the last three decades, while 2) the agricultural workers declined sharply (Table 2-5, page 98). Even the Land Law was amendment in 1962 and has removed 3 ha ceiling on land ownership, it was not so effective in stimulating the land market due to farmers prefer to wait for the windfalls gains from the possible conversion of their land for factories. Thus, income equalizing with the nonfarm families were challenging. The expansion in part-time farming even seem as factor inhibiting expanded operational scale for full time farmers, this activity has also helped to equalize agricultural and nonagricultural and has contributed importantly to social stability by preventing rural depopulation and urban overcrowding. Thus, as the industrialization achieved high level, agricultural protection tend to increase including in Japan.
    (Picture: Paddy field and infrastructure in Ami-machi, Ibaraki)
    Let`s share knowledges, sciences, and experiences
    Technology, Partnership & Equality
  • Energy, It is really our problems

    Energy, It is really our problems

    When you see this picture you will probably ask whether there is a relationship between the coconut tree and our energy problems. I say yes! This is one of the energy source and the way to adapt to a limited acces to the commercial energy or let we say the oils for rural communities. I took this picture when I visited Pasir Mendit, Jangkaran Village, Yogyakarta in September 2005, less than a month before goverment made a new oil price on October 1, 2005 (I mention new price because it increased more than 100% in average).
    At the top of cocconut tree, height more or less 10 meters, you saw a man with a red t-shirt in the first picture. This was the man, age more than 55 years old who collected dry part of cocconut stem and midrib as the main source of energy for daily cooking. He moves from one cocconut tree to other trees 2-3 times a week to support his family energy needs. Thank God, this village full of cocconut trees that also become one of the income source beside the main from farming-base activities. Recently people also diversifying their income sources as the fisher as well as aquaculturist.
    As the oil become the goverment main concern and the main energy source (curently it contributes 63% of primary energy consumption), the other energy source such as renewable energy did not well promote. This country did generated high economic advantages (economic windfall)from the high international oil price in 1970s as Indonesia become the oil net-exporter country. However, the current price to reach US$50 per barrel give worse impact to Indonesian economy as the country switch to the net-importer. As the price increased to reach US$ 70 per barrel in the September 2005, the government predicted the oil subsidy would close to 4.3% of GDP and the deficit of budged reached 1.7% of GDP. Thus, energy will become very crusial issues for the sustainable development including the rural areas.
    Let`s share knowledges, sciences, and experiences
    Technology, Partnership & Equality
  • Penjualan Pulau: Isu di Bulan Maret

    Penjualan Pulau: Isu di Bulan Maret

    Penjualan pulau ternyata bukan hanya berita isapan jempol. Pulau Sultan di kepulauan Riau sempat diiklankan di website privateislandsonline.com walaupun kemudian diumumkan tidak ada pulau yang dijual di wilayah Indonesia oleh media/perusahaan yang sama (klik disini). Rupanya beberapa media dalam negeri terus memberitakan iklan tersebut, seperti Waspada Online 1 Maret, Antara News 3 Maret, 4 Maret, dan Gatra 5 Maret. Sebelumnya, isu yang sama juga sempat bergulir untuk Pulau Bidadari. Media masa rupanya masih menjadi kekuatan keempat setelah Trias Politica yang diusung pemikir Perancis, Montesquieu. Kita berharap pulau-pulau yang berjumlah lebih dari 17.000 di negeri kita dan diantaranya hanya sedikit yang kita ketahui namanya, dapat dikelola dengan lebih baik. Perhatian selama ini masih berpusat di satu pulau yang bernama Jawa, tidak lain karena alasan ekonomi dan politik. Entah bagaimana nasibnya pulau-pulau yang diisukan tersebut jika media massa tidak memberitakannya.
    (Sumber foto: privateislandsonline.com)

    Let`s share knowledges, sciences, and experiences
    Technology, Partnership & Equality
  • Indonesian Marine Capture Fishery: A Limit to Grow

    Indonesian Marine Capture Fishery: A Limit to Grow

    Since 1999, government declared fishery and marine based industry as one of the national economic prime mover. The high economy potential of the bio-resources was believed could potentially drive the growth of the national economy particularly in the coastal rural areas. This paper tried to map the footprint of the marine fishery growth since the early era of Indonesia and recommend a few alternatives fishery management for the future development. The statistical records and some secondary sources were used to delineated how the fishery growth. Since the early of 1900s fishery has extended its frontier through modernization. In the last half century (1951-2001), the fishery production grew dynamically and tended to limit to grow in the current period (1999-2001). While fisher numbers grew higher than production and fishing boats in some periods. Based on the fishing boats structure, the coastal-base was dominating current fishery industry (75%). Heavy exploitation and depletion of the bio-resources might challenge the sustainability of this industry, thus rethinking current fishery management is required. Following were some of the alternatives including 1) rethinking the fishing rights, 2) improving the fishery industry structure, 3) strengthen the monitoring, controlling, and surveillance (MCS) system, 4) incentives for resource conservation and rehabilitation including its habitat, and 5) integrating fishery into overall coastal rural development.

    For ditails please visit my paper on Inovasi Online March 2006 (please note the production data supposed in thousand tons)

    (Picture: tradisional fisher in Madura Island)

    Let`s share knowledges, sciences, and experiences
    Technology, Partnership & Equality
  • Kreativitas ditengah kelangkaan sumberdaya

    Kreativitas ditengah kelangkaan sumberdaya

    Teluk Penyu, pertama kali saya datang di teluk ini dipertengahan 1990an untuk sekadar menyelami bagian permukaan dari dinamika masyarakat pesisir. Akhir tahun 1990an sampai di tahun-tahun terakhr ini lebih sering saya mengujunginya untuk bisa sedikit banyak belajar dari masyarakat ini. Terakhir saya datang September 2005 yang lalu, setelah selama dua bulan Agustus-September tahun sebelumnya “bolak-balik” Jogja-Cilacap untuk mengumpulkan sampel ikan layur. Dalam tahun terakhir ini saya banyak menyimak perubahan yang luar biasa dari teluk ini dimana perahu motor tempel menutupi hampir seluruh ruang terbuka pasir pantai Teluk Penyu. Saya pikir, ini perkembangan yang luar biasa dan rasionalnya kalo terjadi perubahan yang demikian pesat dari ekstraksi sumberdaya ikan pasti masih ada keuntungan yang bisa diperoleh darinya. Itulah kira-kira yang saya tangkap dari dasar teori ekonomi perikanan yang sejak lama diajarkan Gordon. Foto di atas adalah salah seorang nelayan yang sempat saya ajak “ngobrol ngalor ngidul”. Dari sana saya mendapatkan sebagaian pelajaran, bahwa di tengah kelangkaan sumberdaya dan penghasilan yang semakin menipis, kreativitas banyak tumbuh termasuk memodifikasi jaring ingsang dasar dengan tambahan rumpon dari potongan terpal dan “rumbai” dari tali rafia. Dengan cara ini ikan diharapkan akan tertarik sehingga lebih mudah ditangkap. Sepertinya, banyak teknologi lahir dari kreativitas nelayan-nelayan seperti ini seperti lampara dasar yang banyak tumbuh setelah Trawl dilarang karena berbagai tragedi perebuatan sumberdaya di akhir tahun 1970an.
    Let`s share knowledges, sciences, and experiences
    Technology, Partnership & Equality
  • Implication to Management of Marine Capture Fisheries Bioeconomic Model

    Implication to Management of Marine Capture Fisheries Bioeconomic Model

    This paper was published as Suadi, Soeparno, R. Widaningroem, 2003, Implication to Management of Marine Capture Fisheries Bioeconomic Model. GMU Journal of Fisheries Science V(1): 16-24. (In Indonesian language).
    Small-scale marine capture fisheries contributed to community welfare at Yogyakarta’s south coast. Government has planned some programs to develop fisheries. The development supposed only at rational effort in which fishers still gain advantages. Bioeconomic model of Gordon-Schaefer was applied to analyze the issue. CPUE and effort linear regression model is C/f=59,851-0,0005f (R2=82.71%). Fish price assumed at Rp 7,735.19/kg and cost at Rp 59,835.67/trip. Total revenue and effort at MSY management model was predicted at Rp 13.396 billion and 56,860 trip (equals to 327 vessels), respectively. Fisher income at this level is Rp 167,774.51/trip/vessel. Fish exploitation has closed to TAC. Free access equilibrium in which cost is equal to revenue will reach at effort of 102,231 trip (equals to 568 vessels). Managing fisheries at MEY will raise fisher income 17.83% compare to MSY, but total revenue decreased 1.77% at effort only at 56.13% of existing trip. Implications to management of model are how to regulate fisheries at rational efforts and what programs should be promoted. Some management strategies those possible to develop are 1) bordering investment through regulation and permission; 2) rising fishers productivity through technology improvement to exploit under-used fish resources; 3) fisheries extend to offshore through harbor development and social preparation; 4) marketing improvement through revitalization of fish auction; 5) improving handling and post harvest fish technology through training and education; 6) increasing bargaining position through empowering fishers group; 7) promoting alternate incomes through integrated coastal tourism development; and 8) avoiding competition and conflict through developing Java’s south coast cooperation. Participatory approach in planing, developing and evaluating should be promoted to develop Yogyakarta’s south coast.

    (Picture: Sadeng fish harbor in DI Yogyakarta Province, picture by Eko Setyobudi)

    Let`s share knowledges, sciences, and experiences
    Technology, Partnership & Equality
  • Small Pelagic Fisheries in Bay Area

    This paper was published as Suadi, 2002, Small Pelagic Fisheries in Bay Area: A Case Study at Sape Bay West Nusa Tenggara. Journal of Fisheries Science IV(1): 27 -32. (In Indonesian)

    Abstract

    The aims of this research were to know the state of pelagic fishery and social economic aspek of resources exploitation. To examine these issues the research combined survey and descriptive analytic methods. Gordon-Schaefer model applied to analyze the state of fishery and analytical descriptive to explained the relationship of the phenomena’s. Data collection was based on indepth interview and recording of District Fishery Service’s. Pelagic fishes been analyzed were anchovies (Stolephorus sp.), squids (Loligo sp.), and mackerels (Rastrelliger sp.). Pelagic fisheries at Sape Bay had been exploited above maximum TAC mainly 80% of MSY. MSY of anchovies (Stolephorus sp.) reached 2324,9 ton at number of effort 56534 trip and MEY 2172,3 ton at number of effort 42144 trips. MSY of squids (Loligo sp.) is 455,0 ton at number of effort 12183 trip and MEY 449,0 ton at number of effort 10780 trips. The number of trips are equal to Bagan Perahu trips.The model was not applicable to account the MSY and MEY of mackerels (Rastrelliger sp.). The continuing increased of effort will cause the rapid depletion of stock and decreasing of economic rent. Beside face the decreasing of catch per unit of effort, the increasing of competition on fishing ground with marine culture (pearl culture) have resulted fisher stresses. The integrated policy and management are needed to solve these problems and to avoid social riots and the tragedy of the commons occurred.

    Let`s share knowledges, sciences, and experiences
    Technology, Partnership & Equality